Monday, March 13, 2017

Homework #07 Due March 20

Solving Math Word Problems

Instructions:

See the example of a word problem we solved in class before you start doing your homework.

First, copy the exercises or print the word problems;

Second, solve the problems on a separate sheet of paper;

Third, make a cover for your homework: 
Name/Date
Homework number, and title.


Last, ask your parents to double check your work (with you) before you hand it in for teacher’s check.

Here is an exemple of a word problem and how you should solve it.

Exercise 01
Exercise 02

 Exercise 03
 
 Exercise 04
 Exercise 05

Monday, March 6, 2017

Homework #06, Math, Due March 13.

Use/collect information about weather and make a double bar graph.


Exercise in Class.

Observe data and write questions. The answers must be math sentences/equations (2+2=4) involving addition and subtraction.


Question examples:

What is the temperature of Friday and Saturday put together? (Addition).

How much hotter was Friday than Saturday? (Subtraction).

Homework Instructions

Your work must show the maximum temperature and minimum temperature for this period. Plus questions about the bar graph.

(     ) First, check the weather forecast (prediction) from Monday to Sunday this week in Sao Paulo City (and collect weather information).


(      ) Second, organize the weather data in a double bar graph (the way we saw in class). Use A4 paper and a cm ruler to make the bars and lines in the bar graphs.

(      ) Third, write seven questions. The answers must be math sentences/equations (2+2=4) involving addition and subtraction. Answer all the questions.

(      ) Last, add homework number and title, name and date, and finally hand in your work for teacher’s check.

Weather Vocabulary


See an example of a double bar graph:


The Origins of the Roman Empire


Photosynthesis in Plants


Saturday, March 4, 2017

Making a Bar Graph

We have learned in class that bar graphs can be used to show how something changes over time or to compare\contrast items. They have an x-axis (horizontal) and a y-axis (vertical). Typically, the x-axis has numbers for the time period or what is being measured, and the y-axis has numbers for the amount of stuff being measured. Use the data provided and create Bar Gaphs.

Making a Bar Graph - See this Sample:
Exercise 01 - Use the data and create a Bar Gaph
 Exercise 02 - Use the data and create a Bar Gaph
Children Traveling on School Vacation
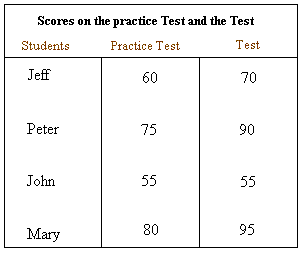
 Exercise 03 - Use the data and create a Bar Gaph
Scores: Practice Test and the Real Test

Exercise 04 - Use the data and create a Bar Gaph
How many books did boys and girls read in one year

Thursday, March 2, 2017

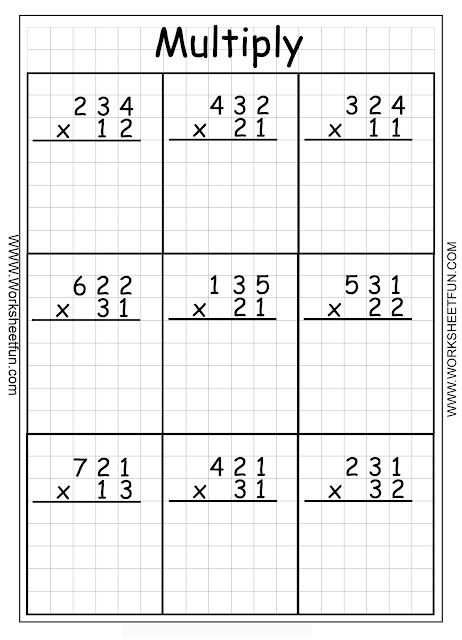
Math Problems - Exercise Selection


Homework 5 Due March 6. Storyboard

Reading Homework - Make a storyboard.

A storyboard is a graphic organizer in the form of illustrations and images displayed in sequence for the purpose of pre-visualizing pictures about a story. The sequence of events of the story chapter #01 is what you must have on the A4 paper. Include a brief description of what is happening on each scene. We did an exercise in class to help you do it.


Your A4 Storyboard Paper must look like this:
Make a one-page cover for your homework 05. Include:

Your Name:
Date:

Homework Number:

Homework Title:

 3rd/4th Grade
Read Chapter #01 and Make a Storyboard.
4th/5th Grade 
Read Chapter #01 and Make a Storyboard.