We have learned in class that bar graphs can be used to show how something changes over time or to compare\contrast items. They have an x-axis (horizontal) and a y-axis (vertical). Typically, the x-axis has numbers for the time period or what is being measured, and the y-axis has numbers for the amount of stuff being measured. Use the data provided and create Bar Gaphs.
Making a Bar Graph - See this Sample:
Exercise 01 - Use the data and create a Bar Gaph
Exercise 02 - Use the data and create a Bar Gaph
Children Traveling on School Vacation
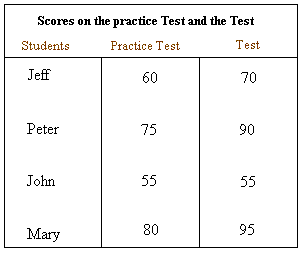
Exercise 03 - Use the data and create a Bar Gaph
Scores: Practice Test and the Real Test
Exercise 04 - Use the data and create a Bar Gaph


No comments:
Post a Comment